TL;DR: GenServers will weirdly hold onto memory when doing work, but not if you do the work in a seperate process.
I was recently working on a project that might feel familiar to some:
- Some data needed to be pulled from an external source
- The pulled data needed to be processed
- The processed data needed to be dumped into a database
- This entire processes needed to be done periodically
For those familiar with Erlang/Elixir, you’ll know that either language can do this in its sleep.
Now I am not here to describe how to write memory-effecient code, or to solve the problem stated above in the absolute best way possible. I am here to tell you about the method(s) I chose, the strange memory issue I was having, how I diagnosed the issue, and how I solved the issue.
NOTE: If you are not familiar with GenServers, you may want to take a look at the elixir-lang intro to them.
I decided to write a simple Elixir application that would start a handful of GenServers. Each GenServer was given a task that it would run periodically on some specified interval. Each GenServer simply ran a task that would fetch, process, and dump some data, and then just wait to run the task again. Basically, the application was a glorified cron job runner.
Though the tasks themselves used a considerable amount of memory (mostly dealing with large binary string values), the processed data would eventually be dumped into a database, so in theory, when a task finished, that memory should be garbage collected
Upon initial implementation and mild benchmarking, it seemed like a Heroku Hobby Dyno was all that was needed to run the app given that it never used much more than ~300MB of memory at any given time, and close to none when idle (i.e. when not running any tasks).
This theory held true after initially deploying the app and having it successfully run its tasks a few times. However, after a few hours the app started choking and the Heroku metrics page indicated that the application was using more than its alloted ~512MB of memory. Yikes! If I wanted to run this application for more than a few days at a time without rebooting it, I would need to upgrade to a more expesnvie Heroku Dyno type.
So what’s going on here? Let’s start w/ some code that roughly simulates the implementation I went with:
defmodule Worker do
  use GenServer

  @interval 1000 * 30

  def start_link do
    GenServer.start_link(__MODULE__, nil, name: :my_worker)
  end

  def init(nil) do
    Process.send_after(self(), :fetch_process_and_dump_data, 1000)
    {:ok, nil}
  end

  def handle_info(:fetch_process_and_dump_data, nil) do
    :ok = fetch_process_and_dump_data()
    Process.send_after(self(), :fetch_process_and_dump_data, @interval)
    {:noreply, nil}
  end

  defp fetch_process_and_dump_data do
    IO.puts("Starting work!")
    fetch_data()
    |> process_data()
    |> dump_data()
  end

  defp fetch_data do
    0..3_000_000
    |> Enum.map(fn _ ->
      1000
      |> :rand.uniform()
      |> to_string()
    end)
    |> Enum.join("_")
  end

  defp process_data(data) do
    data
    |> String.split("_")
    |> Enum.map(fn value ->
      {int, ""} = Integer.parse(value)
      int
    end)
    |> Enum.sum()
  end

  defp dump_data(processed_data) do
    IO.puts("Processed data: #{processed_data}")
  end
end
Here we are defining a simple GenServer module. When an instance of this GenServer is started, it will eventually run the fetch_process_and_dump_data/0 function that is simulating fetching some data, processing that data, and dumping it somewhere. After completing this work, the GenServer will schedule itself to do the same work in 30 seconds.
To simulate fetching some data, we’re just creating a large string that is made up of random numbers seperated by _. To simulate processing this data, we simply parse out all the numbers and sum them up. To simulate dumping this data, we simply print the result to stdout.
Notice how, beyond matching on the :ok response, we do not care about the return value or any of the data the function was dealing with. In theory, all of the memory allocated while running this task should be garbage collected upon the function finishing. However, if we run this code, we can see that this is not what is happening. Feel free to follow along if you have Elixir installed and a terminal to run the code in.
Let’s run this code in an iex> session and use Observer to inspect the memory usage.
We’ll start an iex> session by running the following in a terminal:
$ iex
Once started, we’ll start the Observer GUI:
iex(2)> :observer.start()
:ok
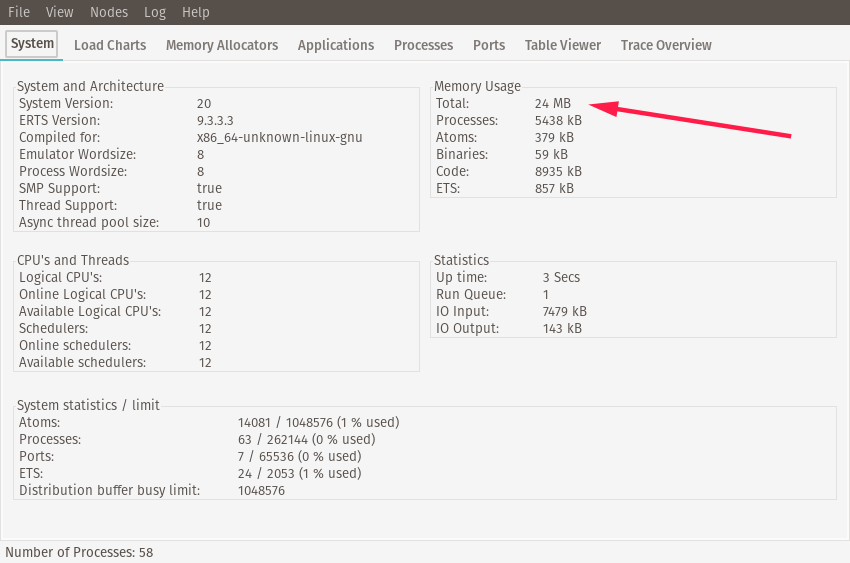
If installed correctly, a GUI should open that basically serves as a System/Activty Monitor, but for the running Elixir application. Mine looks like this:

You can see the current memory usage in the top-right corner. I personally see a value that’s roughly ~24MB, but yours may differ.
We can now copy and paste the Elixir code defining the Worker module directly into iex> and hit enter to compile it:
...truncated...
...(1)>   end
...(1)> end
{:module, Worker,
 <<70, 79, 82, 49, 0, 0, 20, 104, 66, 69, 65, 77, 65, 116, 85, 56, 0, 0, 2, 125,
   0, 0, 0, 61, 13, 69, 108, 105, 120, 105, 114, 46, 87, 111, 114, 107, 101,
   114, 8, 95, 95, 105, 110, 102, 111, 95, 95, ...>>, {:dump_data, 1}}
iex(2)>
Once compiled, we can start a worker by running its start_link/0 function:
iex(2)> Worker.start_link()
{:ok, #PID<0.157.0>}
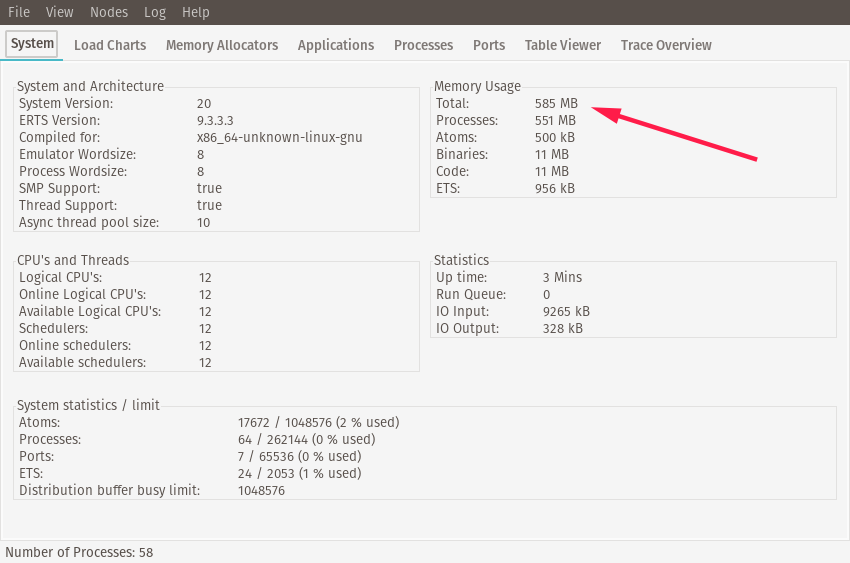
Once started, the worker will begin running its task. As the worker runs, you’ll see the memory usage climb. When I’ve run this, the memory usage gets to be about ~500MB.

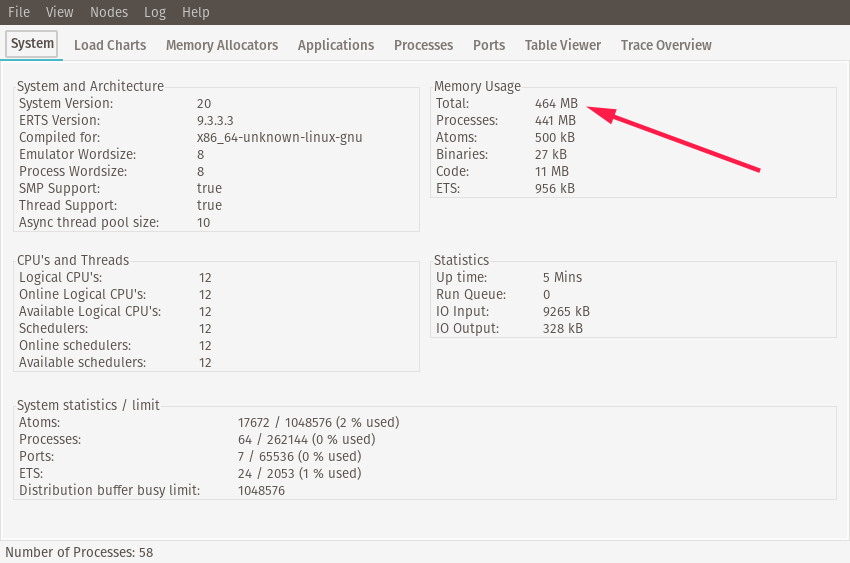
You’ll know the worker has completed its task when you see it print out the "Processed Data: ..." message. Once the worker has completed its task, note the
memory usage. On my computer, the idle memory usage after running a task is usually ~460MB:

What’s going on here? Why is that memory not being garbage collected? Let’s take a closer look via the observer.
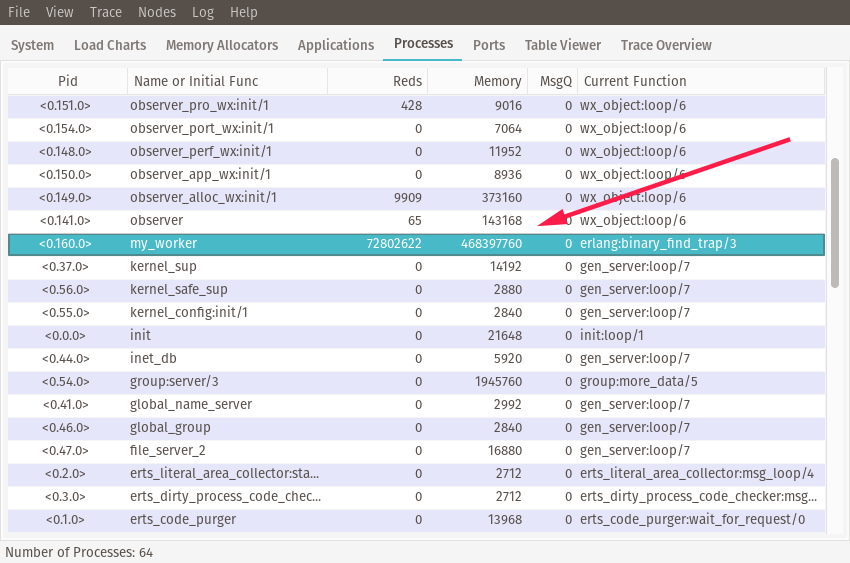
If you click on the Processes tab, you’ll seee a table of all the running processes. Let’s look for our worker process. As you might’ve noticed
in the GenServer code, we named our worker :my_worker. This will allow us to find it by name in the table. You can click on the Name or Initial Func column header to sort by name, and scroll
until you find my_worker.

If you look under its Memory column, you’ll see the process is still holding onto a ton of memory, despite the code not explictly referencing or using the data generated by the work after the function completes. What’s going on here?
To be honest, I am not sure. I’ve done some Googling and read some random posts about how GenServers might be holding onto some of these references for caching purposes, but I came to no conclusion that I feel confident enough about to share. However, I do have a solution that I will gladly share!
Let’s modify the code just a tiny bit:
defmodule Worker do
  use GenServer

  @interval 1000 * 30

  def start_link do
    GenServer.start_link(__MODULE__, nil, name: :my_worker)
  end

  def init(nil) do
    Process.send_after(self(), :fetch_process_and_dump_data, 1000)
    {:ok, nil}
  end

  def handle_info(:fetch_process_and_dump_data, nil) do
    :ok =
      fn -> fetch_process_and_dump_data() end
      |> Task.async()
      |> Task.await(100_000)

    Process.send_after(self(), :fetch_process_and_dump_data, @interval)
    {:noreply, nil}
  end

  defp fetch_process_and_dump_data do
    IO.puts("Starting work!")

    fetch_data()
    |> process_data()
    |> dump_data()
  end

  defp fetch_data do
    0..3_000_000
    |> Enum.map(fn _ ->
      1000
      |> :rand.uniform()
      |> to_string()
    end)
    |> Enum.join("_")
  end

  defp process_data(data) do
    data
    |> String.split("_")
    |> Enum.map(fn value ->
      {int, ""} = Integer.parse(value)
      int
    end)
    |> Enum.sum()
  end

  defp dump_data(processed_data) do
    IO.puts("Processed data: #{processed_data}")
  end
end
I only changed about 3 lines of code, but posted the whole module to make it easier to copy and paste. The only change made was
in handle_info/2. Instead of just calling fetch_process_and_dump_data/0 directly, we are now executing the function
within a Task (read more about Task.async and Task.await here). Essentially what this does is
run the function in a seperate process.
This should result in the same work being done, and, as you will see, very different memory implications.
Let’s kill the current iex> session and start another one, copy and paste this modified code in, and run :observer.start(). Just like before, take note of the starting memory usage.
Now let’s start the new-and-improved worker:
iex> Worker.start_link()
{:ok, #PID<0.162.0>}
Once the worker begins its task, you should see the total memory usage climb. Wait until the worker completes its work, and now watch the memory usage. Unless I am just crazy or have some strange hardware, you should see the memory usage drop back to roughly the amount it started at. Success!
Now I do not want the emphasis to be on the use of Elixir’s Task module. Instead, I want to focus on how the code is now executing the memory-intensive work
in a seperate process, where Task.async/1 was just one of many ways to accomplish this. The idea here is, if all the work is done in a seperate process, that process
will be what allocates the memory, and when it completes its work and is killed off, the memory will be garbage collected.
Though I cannot prove beyond this example that this is in fact what is happening, I can speak from experience that this solution works in a real production system. When I modified the Heroku worker application to run its work in seperate processes, the memory usage went from climbing to upwards of ~0.5GB to staying at roughly ~0.25GB, which was more than enough to keep running this application on a Heroku Hobby Dyno.
I’d be interested in hearing from anyone who might better understand what is going at the GenServer level and who might be able to explain this strange behavior.